Cycling Training Zones Guide
New year, new training? To start the year, our resident coach, Matt Rowe, dives into the importance of training zones to ensure you get the best out of your training and are event ready.
What are ‘training zones’?
Training zones define ranges in intensity of exercise that can be used to regulate how hard you train. There are three broad tools used to define training zones in cycling;
- Rate of Perceived Exertion (RPE – your sensations);
- Heart rate (for example, measuring with a Garmin heart rate monitor); or
- Power (for example, measured with Garmin Rally power meter pedals).
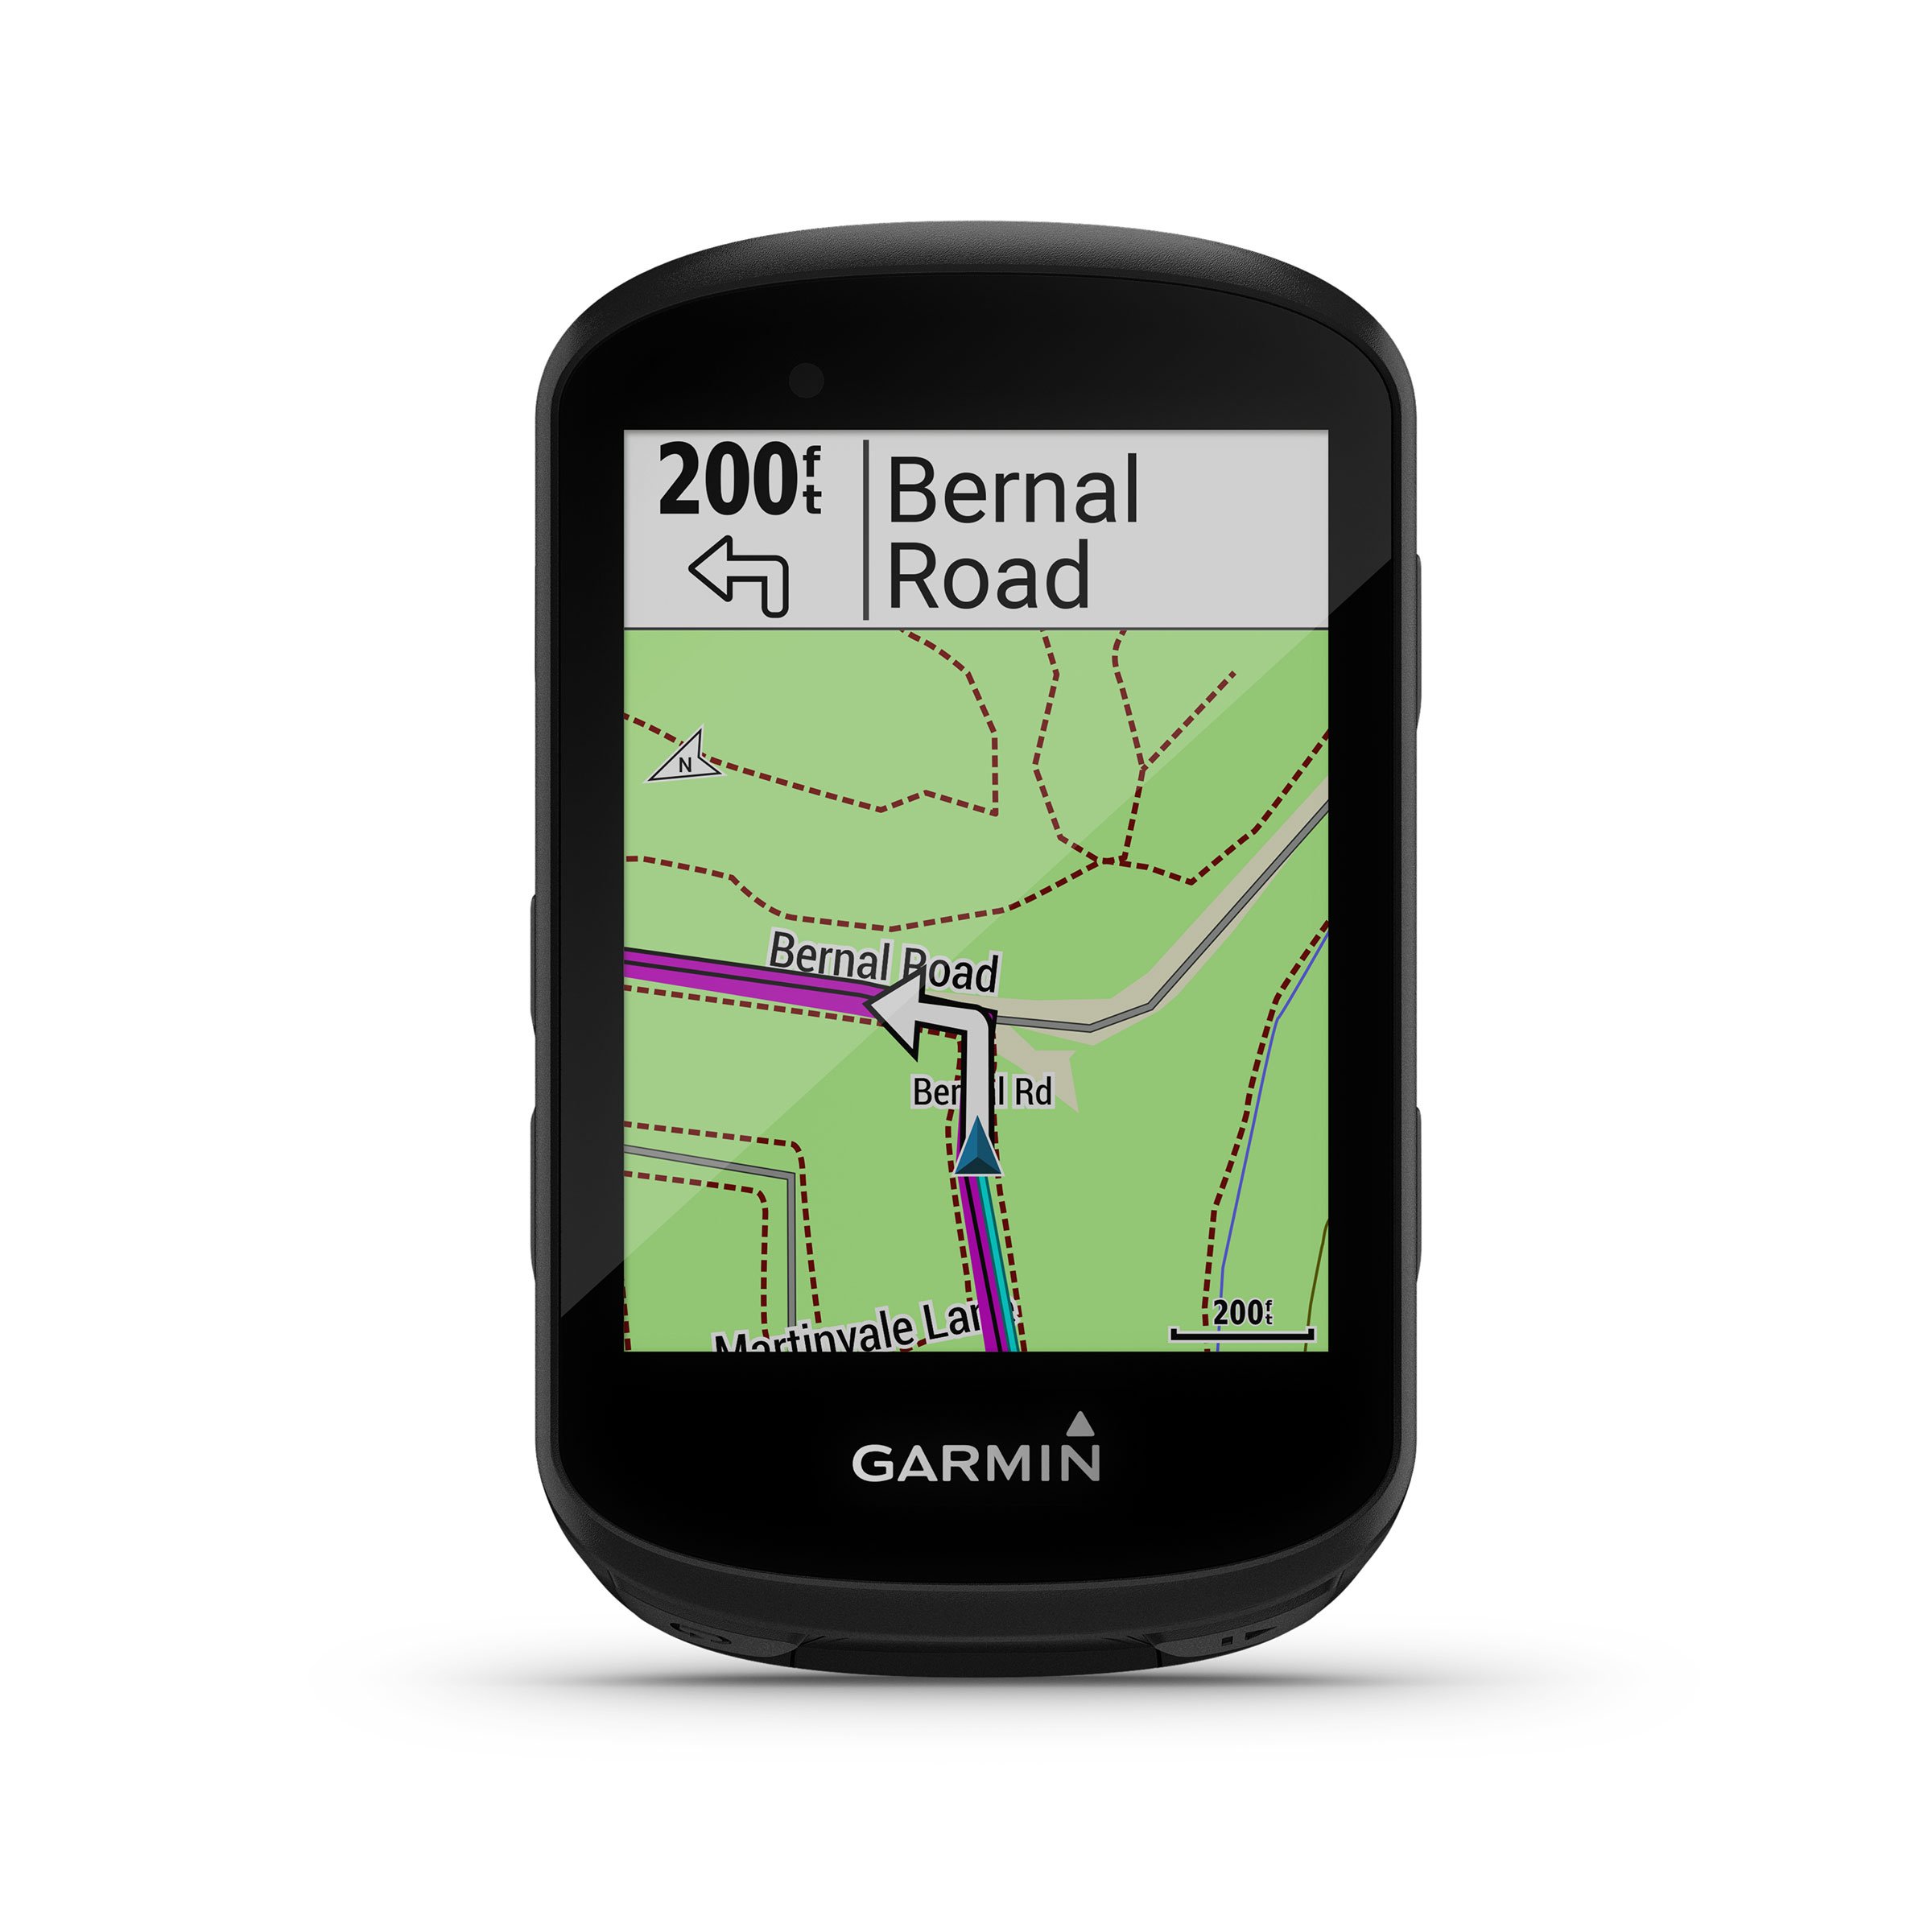
There are advantages and disadvantages of each tool, with power being the gold standard in cycling due to being the most accurate measure of work done. To illustrate, Garmin Rally power meter pedals measure the force you apply a few hundred times every second, which is displayed on your Edge device in real time. If you get out of the saddle and apply a little extra force – that spike in Wattage in to a higher training zone will display instantly – something simply not possible using heart rate or RPE.
How do you define your training zones?
We can define and express your training zones in terms of:
- Feel – based on RPE;
- Bpm – using heart rate; or
- Watts – using power.
It is important to note that there are plenty of nomenclatures used to define training zones, with some models more appropriate for riders, and others coaches.
Dr. Andy Coggan’s seven training zone model is well versed, and is what I personally use as coach at Rowe & King – ranging from active recovery, through to a max sprint effort. Conveniently, the 7 zones translate in to RPE, Heart Rate and Power, so whichever tool you are using to guide your training intensities – Dr. Andy Coggan’s 7 Zone Model works. See the table below for details on each of the 7 zones.
| Level | Name/Purpose | % of Threshold Power | % of Threshold HR | RPE |
|---|---|---|---|---|
| 1 | Active Recovery | ≤55% | ≤68% | <2 |
| 2 | Endurance | 56-75% | 69-83% | 2-3 |
| 3 | Tempo | 76-90% | 84-94% | 3-4 |
| 4 | Lactate Threshold | 91-105% | 95-105% | 4-5 |
| 5 | VO2 Max | 106-120% | >106% | 6-7 |
| 6 | Anaerobic Capacity | 121-150% | N/A | >7 |
| 7 | Neuromuscular Power | N/A | N/A | (Maximal) |
Calculating your training zones
Borg’s rating of perceived exertion (RPE) is an outcome measure scale, ranging from 1 – very slight exertion, on a sliding scale through to 10 – maximal. Note, the RPE scale is not linear, in recognition of the non-linear response of physiological factors during exercise, i.e. blood and muscle lactate, which increases exponentially once you go beyond your lactate threshold. The RPE model requires you to be self conscious in reflecting the sensations experienced during a ride or an effort.
When defining your training zones using heart rate or and power, we first need to determine your threshold. In simple terms, your threshold heart rate is calculated by taking your average heart rate from the final 20 minutes of a 30 minute max time trial effort. The first 10 minutes are key to enable your heart rate to rise to around your threshold.
When calculating your threshold power, there are a few credible methods requiring best efforts over an hour, 20 minutes, 2 x 8 minutes, or a ramp test. I would suggest using more than one testing method to help validate your result. Remember – an ‘ftp test’ only gives you an estimate of your threshold power, which in reality is a power range on any given day. 95% of your best 20 minute effort is the most common method used.
Once you know your threshold – you can calculate your training zones using the percentages in the table above.
Why define your training zones?
You can be more targeted with your training, ensuring you are training at the specific intensities designed to promote the physiological adaptions best aligned to your targets / goals. For example.. if you are training for a 100 mile sportive event, it’s important to develop your endurance, so being disciplined and keeping the intensity relatively low (within Zone 2) is key. At the start of a ride when fresh, it’s easy to go too hard, surging in to zones 3 and 4, before fading in the final hour of your ride. Having a power meter and knowing the range of power you should be targeting will help you train smarter, not harder.
You will need to know your training zones when trying to complete structured training, and by using power you are able to be much more accurate in executing your chosen intervals. As an example, Egan Bernal, 2019 Tour de France and 2021 Giro d’Italia champion recently created a workout on Zwift containing two blocks of ‘Over-Under’ efforts, where you are required to alternate your power between Zone 3 for 2 minutes and Zone 4 for a minute, with the aim of increasing your force production / threshold power. Workouts like this are only possible, if you know your training zones – with power being the optimum approach.
In my next blog post, we will explore ‘functional threshold power’ (FTP) – a critical intensity for endurance cyclists.
Setting up your training zones on a Garmin device
Garmin fitness devices assign heart rate zones based on your maximum and resting heart rates set in your user profile.
You can manually input your power zones on your Edge device or using Garmin Connect. If you know your FTP, you can enter it and the software will calculate your power zones automatically.
Click here to learn more on setting up power zones.


